9th Legislative District (New Jersey)
| New Jersey's 9th Legislative District | |
|---|---|
 | |
| Senator | Christopher J. Connors (R) |
| Assembly members | Brian E. Rumpf (R) DiAnne Gove (R) |
| Registration |
|
| Demographics |
|
| Population | 236,923 |
| Voting-age population | 194,710 |
| Registered voters | 168,555 |
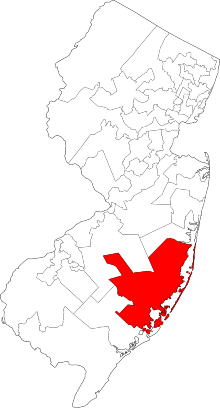
New Jersey's 9th Legislative District is one of 40 in the New Jersey Legislature, covering the Atlantic County municipalities of Galloway Township and Port Republic City; the Burlington County municipalities of Bass River Township, Tabernacle Township and Washington Township; and the Ocean County municipalities of Barnegat Township, Barnegat Light Borough, Beach Haven Borough, Beachwood Borough, Berkeley Township, Eagleswood Township, Harvey Cedars Borough, Lacey Township, Little Egg Harbor Township, Long Beach Township, Ocean Township, Ocean Gate Borough, Pine Beach Borough, Seaside Park Borough, Ship Bottom Borough, South Toms River Borough, Stafford Township, Surf City Borough and Tuckerton Borough as of the 2011 apportionment.[1]
As of the 2010 United States Census, the district had a population of 236,923, of whom 194,710 (82.2%) were of voting age. The racial makeup of the district was 220,543 (93.1%) White, 4,973 (2.1%) African American, 321 (0.1%) Native American, 3,121 (1.3%) Asian, 49 (0.0%) Pacific Islander, 3,121 (1.3%) from some other race, and 3,247 (1.4%) from two or more races. Hispanic or Latino of any race were 14,969 (6.3%) of the population.[2] The district had 168,555 registered voters as of November 30, 2017, of whom 74,699 (44.3%) were registered as unaffiliated, 54,146 (32.1%) were registered as Republicans, 38,657 (22.9%) were registered as Democrats, and 1,053 (0.6%) were registered to other parties.[3]
Contents
1 Political representation
2 1965–1973
3 District composition since 1973
4 Election history
5 Election results, 1973–present
5.1 Senate
5.2 Assembly
6 Election results, 1965–1973
6.1 Senate
6.2 Assembly
6.2.1 District 9A
6.2.2 District 9B
6.2.3 District 9C
6.2.4 District 9 At-large
7 References
Political representation
The district is represented for the 2018–2019 Legislative Session (Senate, General Assembly) in the State Senate by Christopher J. Connors (R, Lacey Township) and in the General Assembly by Brian E. Rumpf (R, Little Egg Harbor Township) and DiAnne Gove (R, Long Beach Township).[4][5]
1965–1973
During the period of time after the 1964 Supreme Court decision in Reynolds v. Sims and before the establishment of a 40-district legislature in 1973, the 9th District encompassed the entirety of Union County. Two Senators were elected in the 1965 election (Republican Nelson Stamler and Democrat Mildred Barry Hughes)[6] while three were elected in the 1967 and 1971 elections. Republicans Nicholas S. LaCorte, Frank X. McDermott, and Matthew John Rinaldo won the 1967 election though LaCorte would resign on December 7, 1970 to become a tax appeals judge.[7][8] Democrat Jerry Fitzgerald English would win a 1971 special election to complete LaCorte's term.[8] Republicans would win the three seats in the regular 1971 election with Rinaldo, McDermott, and Jerome Epstein receiving the most votes in that election.[9] Following Rinaldo's election to Congress in 1972 elections, Democrat William J. McCloud would be elected to complete Rinaldo's term in the Senate.[8]
In the Assembly, for the 1967, 1969, and 1971 elections, Union County was divided into three districts (9A, 9B, and 9C) that each elected two members of the Assembly. In addition, in the 1967 and 1969 elections, one additional member of the Assembly was elected county-wide.[10][11]
The members elected to the Assembly from each district are as follows:[7][12][9]
| Session | District 9A | District 9B | District 9C | District 9 At-large |
|---|---|---|---|---|
| 1968–1969 | Joseph J. Higgins (D) | Herbert J. Heilmann (R) | Peter McDonough (R) | Charles J. Irwin (R) |
Henry F. Gavan (D) | Herbert H. Kiehn (R) | Hugo Pfaltz (R) | ||
| 1970–1971 | Joseph J. Higgins (D) | Herbert J. Heilmann (R)[A 1] | Peter McDonough (R) | Charles J. Irwin (R) |
Elizabeth Cox (R)[A 2] | ||||
Henry F. Gavan (D) | Hugo Pfaltz (R) | Herbert H. Kiehn (R) | ||
| 1972–1973 | Joseph J. Higgins (D) | C. Louis Bassano (R) | Peter McDonough (R) | Seat eliminated |
Alexander J. Menza (D) | Herbert H. Kiehn (R) | Arthur Manner (R) |
^ Resigned to become Assistant Commissioner of Labor on December 1, 1970
^ Elected in 1971 special election to complete Heilmann's unexpired term
District composition since 1973
Since the creation of 40 equal-population districts statewide in 1973, the 9th District has been based in and around Ocean County. For the 1973 district, the 9th consisted of most of Ocean County (all municipalities except Little Egg Harbor Township, Tuckerton, Manchester Township, Lakehurst, Point Pleasant, and Point Pleasant Beach), Woodland Township in Burlington County, and Millstone Township in Monmouth County.[13] In the 1981 redistricting, the large townships of Lakewood, Brick, and Dover and other nearby small boroughs were removed but the remainder of Ocean County municipalities were added as well as Bass River Township and Burlington County's New Hanover Township, Wrightstown, and North Hanover.[14]Jackson Township and Plumsted Township and the northern Burlington municipalities were shifted out of the 9th in the 1991 redistricting; more of southern Burlington was added including Tabernacle, Woodland, Washington, and Bass River townships and Egg Harbor City in Atlantic County were also added to the district for this decade.[15] In the 2001 redistricting, the Ocean County portion of the district barely changed but only Washington and Bass River townships remained in Burlington County and the municipalities that made up the Atlantic County portion of the district were Hammonton and Folsom.[16]
Election history
| Session | Senate | Assembly | |
|---|---|---|---|
| 1974–1975 | John F. Russo (D) | John Paul Doyle (D) | Daniel F. Newman (D) |
| 1976–1977 | John Paul Doyle (D) | Daniel F. Newman (D) | |
| 1978–1979 | John F. Russo (D) | John Paul Doyle (D) | Daniel F. Newman (D) |
| 1980–1981 | John Paul Doyle (D) | Hazel Gluck (R) | |
| 1982–1983 | Leonard T. Connors (R) | John T. Hendrickson Jr. (R) | Jorge A. Rod (R) |
| 1984–1985 | Leonard T. Connors (R) | John T. Hendrickson Jr. (R) | Jorge A. Rod (R) |
Jorge A. Rod (D)[n 1] | |||
| 1986–1987 | John T. Hendrickson Jr. (R) | Jeffrey Moran (R) | |
| 1988–1989 | Leonard T. Connors (R) | John T. Hendrickson Jr. (R)[n 2] | Jeffrey Moran (R) |
| 1990–1991 | Christopher J. Connors (R) | Jeffrey Moran (R) | |
| 1992–1993 | Leonard T. Connors (R) | Christopher J. Connors (R) | Jeffrey Moran (R) |
| 1994–1995 | Leonard T. Connors (R) | Christopher J. Connors (R) | Jeffrey Moran (R) |
| 1996–1997 | Christopher J. Connors (R) | Jeffrey Moran (R) | |
| 1998–1999 | Leonard T. Connors (R) | Christopher J. Connors (R) | Jeffrey Moran (R) |
| 2000–2001 | Christopher J. Connors (R) | Jeffrey Moran (R) | |
| 2002–2003 | Leonard T. Connors (R) | Christopher J. Connors (R) | Jeffrey Moran (R)[n 3] |
Brian E. Rumpf (R)[n 4] | |||
| 2004–2005 | Leonard T. Connors (R) | Christopher J. Connors (R) | Brian E. Rumpf (R) |
| 2006–2007 | Christopher J. Connors (R) | Brian E. Rumpf (R) | |
| 2008–2009 | Christopher J. Connors (R) | Daniel Van Pelt (R)[n 5] | Brian E. Rumpf (R) |
DiAnne Gove (R)[n 6] | |||
| 2010–2011 | DiAnne Gove (R) | Brian E. Rumpf (R) | |
| 2012–2013 | Christopher J. Connors (R) | DiAnne Gove (R) | Brian E. Rumpf (R) |
| 2014–2015 | Christopher J. Connors (R) | DiAnne Gove (R) | Brian E. Rumpf (R) |
| 2016–2017 | DiAnne Gove (R) | Brian E. Rumpf (R) | |
| 2018–2019 | Christopher J. Connors (R) | DiAnne Gove (R) | Brian E. Rumpf (R) |
^ Switched parties on August 27, 1985[17]
^ Resigned September 1, 1989 to become part of the Department of Community Affairs
^ Resigned June 17, 2003 to become Ocean County Surrogate
^ Appointed June 23, 2003
^ Resigned on July 31, 2009 following his arrest in relation to Operation Bid Rig
^ Appointed December 7, 2009
Election results, 1973–present
Senate
| Party | Candidate | Votes | % | ± | |
|---|---|---|---|---|---|
Republican | Christopher J. Connors | 41,438 | 64.6 | ||
Democratic | Brian Corley White | 22,717 | 35.4 | ||
| Total votes | 64,155 | 100.0 | |||
| Party | Candidate | Votes | % | ± | |
|---|---|---|---|---|---|
Republican | Christopher J. Connors | 46,949 | 70.8 | ||
Democratic | Anthony Mazzella | 19,365 | 29.2 | ||
| Total votes | 66,314 | 100.0 | |||
| Party | Candidate | Votes | % | |
|---|---|---|---|---|
Republican | Christopher J. Connors | 32,027 | 64.9 | |
Democratic | Dorothy A. Ryan | 17,320 | 35.1 | |
| Total votes | 49,347 | 100.0 | ||
| Party | Candidate | Votes | % | ± | |
|---|---|---|---|---|---|
Republican | Christopher J. Connors | 35,504 | 62.3 | ||
Democratic | Russell K. Corby | 21,524 | 37.7 | ||
| Total votes | 57,028 | 100.0 | |||
| Party | Candidate | Votes | % | ± | |
|---|---|---|---|---|---|
Republican | Leonard T. Connors, Jr. | 36,539 | 65.6 | ||
Democratic | Aviva Twersky-Glasner | 18,995 | 34.4 | ||
| Total votes | 55,534 | 100.0 | |||
| Party | Candidate | Votes | % | |
|---|---|---|---|---|
Republican | Leonard T. Connors, Jr. | 43,303 | 58.7 | |
Democratic | Peter A. Terranova | 29,885 | 40.5 | |
| Common Sense Independent | Mark Schreckenstein | 588 | 0.8 | |
| Total votes | 73,776 | 100.0 | ||
| Party | Candidate | Votes | % | ± | |
|---|---|---|---|---|---|
Republican | Leonard T. Connors, Jr. | 45,880 | 60.0 | ||
Democratic | Bill Zimmermann, Jr. | 28,508 | 37.3 | ||
Conservative | Leonard P. Marshall | 2,139 | 2.8 | N/A | |
| Total votes | 76,527 | 100.0 | |||
| Party | Candidate | Votes | % | ± | |
|---|---|---|---|---|---|
Republican | Leonard T. Connors, Jr. | 50,464 | 65.2 | ||
Democratic | Joseph Meglino | 26,947 | 34.8 | ||
| Total votes | 77,411 | 100.0 | |||
| Party | Candidate | Votes | % | |
|---|---|---|---|---|
Republican | Leonard T. Connors, Jr. | 42,914 | 69.9 | |
Democratic | Joseph Meglino | 18,448 | 30.1 | |
| Total votes | 61,362 | 100.0 | ||
| Party | Candidate | Votes | % | ± | |
|---|---|---|---|---|---|
Republican | Leonard T. Connors, Jr. | 35,456 | 64.0 | ||
Democratic | Joan M. Tredy | 19,964 | 36.0 | ||
| Total votes | 55,420 | 100.0 | |||
| Party | Candidate | Votes | % | ± | |
|---|---|---|---|---|---|
Republican | Leonard T. Connors, Jr. | 31,028 | 63.3 | ||
Democratic | Anthony M. Sellitto, Jr. | 17,989 | 36.7 | ||
| Total votes | 49,017 | 100.0 | |||
| Party | Candidate | Votes | % | |
|---|---|---|---|---|
Republican | Leonard T. Connors, Jr. | 40,656 | 64.4 | |
Democratic | Wesley K. Bell | 22,441 | 35.6 | |
| Total votes | 63,097 | 100.0 | ||
| Party | Candidate | Votes | % | ± | |
|---|---|---|---|---|---|
Democratic | John F. Russo | 53,309 | 63.7 | ||
Republican | James J. Mancini | 28,673 | 34.3 | ||
Libertarian | Leonard T. Flynn | 1,153 | 1.4 | N/A | |
Independent | Donald Knause | 494 | 0.6 | N/A | |
| Total votes | 83,629 | 100.0 | |||
| Party | Candidate | Votes | % | |
|---|---|---|---|---|
Democratic | John F. Russo | 38,388 | 54.5 | |
Republican | Benjamin H. Mabie | 32,010 | 45.5 | |
| Total votes | 70,398 | 100.0 | ||
Assembly
| Party | Candidate | Votes | % | ± | |
|---|---|---|---|---|---|
Republican | Brian E. Rumpf | 40,158 | 31.9 | ||
Republican | DiAnne C. Gove | 39,523 | 31.4 | ||
Democratic | Jill Dobrowansky | 23,534 | 18.7 | ||
Democratic | Ryan Young | 22,721 | 18.0 | ||
| Total votes | 125,936 | 100.0 | |||
| Party | Candidate | Votes | % | ± | |
|---|---|---|---|---|---|
Republican | Brian E. Rumpf | 24,325 | 33.4 | ||
Republican | DiAnne C. Gove | 23,676 | 32.5 | ||
Democratic | Fran Zimmer | 12,638 | 17.4 | ||
Democratic | John Bingham | 12,171 | 16.7 | ||
| Total votes | 72,810 | 100.0 | |||
| Party | Candidate | Votes | % | ± | |
|---|---|---|---|---|---|
Republican | Brian E. Rumpf | 45,690 | 35.5 | ||
Republican | DiAnne C. Gove | 43,695 | 34.0 | ||
Democratic | Christopher J. McManus | 20,354 | 15.8 | ||
Democratic | Peter Ferwerda III | 18,872 | 14.7 | ||
| Total votes | 128,611 | 100.0 | |||
| Party | Candidate | Votes | % | |
|---|---|---|---|---|
Republican | Brian E. Rumpf | 30,896 | 32.3 | |
Republican | DiAnne C. Gove | 29,898 | 31.2 | |
Democratic | Carla Kearney | 17,648 | 18.4 | |
Democratic | Bradley Billhimer | 17,338 | 18.1 | |
| Total votes | 95,780 | 100.0 | ||
| Party | Candidate | Votes | % | ± | |
|---|---|---|---|---|---|
Republican | Brian E. Rumpf | 54,311 | 34.2 | ||
Republican | DiAnne Gove | 52,667 | 33.2 | ||
Democratic | Richard P. Visotcky | 26,482 | 16.7 | ||
Democratic | Robert E. Rue | 25,365 | 16.0 | ||
| Total votes | 158,825 | 100.0 | |||
| Party | Candidate | Votes | % | ± | |
|---|---|---|---|---|---|
Republican | Brian E. Rumpf | 33,281 | 30.3 | ||
Republican | Daniel M. Van Pelt | 31,321 | 28.5 | ||
Democratic | Michele F. Rosen | 22,954 | 20.9 | ||
Democratic | William Coulter | 22,295 | 20.3 | ||
| Total votes | 109,851 | 100.0 | |||
| Party | Candidate | Votes | % | ± | |
|---|---|---|---|---|---|
Republican | Christopher J. Connors | 47,863 | 32.1 | ||
Republican | Brian E. Rumpf | 44,761 | 30.0 | ||
Democratic | Dolores J. Coulter | 29,365 | 19.7 | ||
Democratic | James Den Uyl | 27,060 | 18.2 | ||
| Total votes | 149,049 | 100.0 | |||
| Party | Candidate | Votes | % | ± | |
|---|---|---|---|---|---|
Republican | Christopher J. Connors | 35,580 | 32.7 | ||
Republican | Brian E. Rumpf | 31,307 | 28.7 | ||
Democratic | Dolores J. Coulter | 21,282 | 19.5 | ||
Democratic | Peter A. Terranova | 20,763 | 19.1 | ||
| Total votes | 108,932 | 100.0 | |||
| Party | Candidate | Votes | % | |
|---|---|---|---|---|
Republican | Christopher J. Connors | 44,004 | 30.1 | |
Republican | Jeffrey W. Moran | 43,178 | 29.6 | |
Democratic | John F. Ryan | 30,385 | 20.8 | |
Democratic | Robert DiBella | 28,521 | 19.5 | |
| Total votes | 146,088 | 100.0 | ||
| Party | Candidate | Votes | % | ± | |
|---|---|---|---|---|---|
Republican | Christopher J. Connors | 31,492 | 30.6 | ||
Republican | Jeffrey W. Moran | 31,182 | 30.3 | ||
Democratic | S. Karl Mohel | 18,698 | 18.2 | ||
Democratic | Jack Ryan | 18,640 | 18.1 | ||
Conservative | John N. Cardello | 1,548 | 1.5 | ||
Conservative | James W. Eissing | 1,335 | 1.3 | ||
| Total votes | 102,895 | 100.0 | |||
| Party | Candidate | Votes | % | ± | |
|---|---|---|---|---|---|
Republican | Jeffrey W. Moran | 47,232 | 31.9 | ||
Republican | Christopher J. Connors | 47,205 | 31.9 | ||
Democratic | Sharon Fumei | 25,398 | 17.1 | ||
Democratic | Michael G. Carrig | 24,298 | 16.4 | ||
Conservative | James W. Eissing | 2,015 | 1.4 | ||
Conservative | Nancy L. Eissing | 2,009 | 1.4 | ||
| Total votes | 148,157 | 100.0 | |||
| Party | Candidate | Votes | % | ± | |
|---|---|---|---|---|---|
Republican | Christopher J. Connors | 33,394 | 32.7 | ||
Republican | Jeffrey W. Moran | 33,113 | 32.4 | ||
Democratic | Miriam Wolkofsky | 14,979 | 14.6 | ||
Democratic | Matt Cutano | 14,959 | 14.6 | ||
Conservative | Nancy L. Eissing | 2,992 | 2.9 | N/A | |
Conservative | Leonard P. Marshall | 2,835 | 2.8 | N/A | |
| Total votes | 102,272 | 100.0 | |||
| Party | Candidate | Votes | % | ± | |
|---|---|---|---|---|---|
Republican | Christopher J. Connors | 49,885 | 32.5 | ||
Republican | Jeffrey W. Moran | 49,363 | 32.2 | ||
Democratic | Thomas Woolsey | 27,046 | 17.6 | ||
Democratic | Robert K. Smith | 26,979 | 17.6 | ||
| Total votes | 153,273 | 100.0 | |||
| Party | Candidate | Votes | % | |
|---|---|---|---|---|
Republican | Christopher J. Connors | 41,977 | 34.7 | |
Republican | Jeffrey W. Moran | 41,928 | 34.6 | |
Democratic | Len Morano | 18,821 | 15.5 | |
Democratic | Edward W. Frydendahl, Jr. | 18,388 | 15.2 | |
| Total votes | 121,114 | 100.0 | ||
| Party | Candidate | Votes | % | ± | |
|---|---|---|---|---|---|
Republican | Christopher J. Connors | 38,013 | 25.8 | ||
Republican | Jeffrey W. Moran | 37,604 | 25.5 | ||
Democratic | Lawrence J. Williams | 35,933 | 24.4 | ||
Democratic | Joseph Meglino | 35,753 | 24.3 | ||
| Total votes | 147,303 | 100.0 | |||
| Party | Candidate | Votes | % | ± | |
|---|---|---|---|---|---|
Republican | John T. Hendrickson, Jr. | 34,525 | 31.7 | ||
Republican | Jeffrey W. Moran | 33,433 | 30.7 | ||
Democratic | Judy Anderson | 20,772 | 19.1 | ||
Democratic | Harry F. Schmoll, Jr. | 20,288 | 18.6 | ||
| Total votes | 109,018 | 100.0 | |||
| Party | Candidate | Votes | % | ± | |
|---|---|---|---|---|---|
Republican | John T. Hendrickson, Jr. | 39,031 | 32.4 | ||
Republican | Jeffrey W. Moran | 37,877 | 31.4 | ||
Democratic | Jorge A. Rod | 23,470 | 19.5 | ( | |
Democratic | Warren E. Hickman | 19,420 | 16.1 | ||
| "Time for Change" | Paul David Hedrich | 708 | 0.6 | N/A | |
| Total votes | 120,506 | 100.0 | |||
| Party | Candidate | Votes | % | ± | |
|---|---|---|---|---|---|
Republican | John T. Hendrickson, Jr. | 30,427 | 31.5 | ||
Republican | Jorge A. Rod | 29,206 | 30.2 | ||
Democratic | Lawrence Scott Reynolds | 18,501 | 19.1 | ||
Democratic | Joseph J. Bloom, Jr. | 17,656 | 18.3 | ||
| Equality for All | Donald J. Knause | 875 | 0.9 | ||
| Total votes | 96,665 | 100.0 | |||
| Party | Candidate | Votes | % | |
|---|---|---|---|---|
Republican | John T. Hendrickson, Jr. | 38,908 | 31.5 | |
Republican | Jorge A. Rod | 36,890 | 29.9 | |
Democratic | Charles Goodman | 23,303 | 18.9 | |
Democratic | Anges A. Gill | 23,085 | 18.7 | |
| "Equality For All" | Donald J. Knause | 818 | 0.7 | |
Libertarian | Milos Formanek | 227 | 0.2 | |
Libertarian | Charlene Gaudette | 225 | 0.2 | |
| Total votes | 123,456 | 100.0 | ||
| Party | Candidate | Votes | % | ± | |
|---|---|---|---|---|---|
Democratic | John Paul Doyle | 37,238 | 24.9 | ||
Republican | Hazel Gluck | 37,221 | 24.9 | ||
Democratic | Daniel F. Newman | 36,524 | 24.4 | ||
Republican | H. George Buckwald | 34,503 | 23.0 | ||
Libertarian | Virginia A. Flynn | 1,560 | 1.0 | N/A | |
Libertarian | Cindy Kretchman | 1,317 | 0.9 | N/A | |
| Down With Lawyers | Bill Gahres | 872 | 0.6 | ||
| True Justice | Elizabeth Ann Silverstein | 250 | 0.2 | N/A | |
| True Justice | Marc David Silverstein | 220 | 0.1 | N/A | |
| Total votes | 149,705 | 100.0 | |||
| Party | Candidate | Votes | % | ± | |
|---|---|---|---|---|---|
Democratic | John Paul Doyle | 49,960 | 30.7 | ||
Democratic | Daniel F. Newman | 49,387 | 30.4 | ||
Republican | Stephen A. Pepe | 30,173 | 18.6 | ||
Republican | John T. Hendrickson, Jr. | 29,858 | 18.4 | ||
| Independents for Independence | William A. Hall | 1,285 | 0.8 | N/A | |
| Independents for Independence | John J. Conard | 1,199 | 0.7 | ||
| Right To Die | Bill Gahres | 688 | 0.4 | ||
| Total votes | 162,550 | 100.0 | |||
| Party | Candidate | Votes | % | ± | |
|---|---|---|---|---|---|
Democratic | John Paul Doyle | 35,707 | 25.4 | ||
Democratic | Daniel F. Newman | 35,337 | 25.1 | ||
Republican | Franklin V. Fischer | 33,174 | 23.6 | ||
Republican | James M. Havey | 32,847 | 23.4 | ||
| Very Independent Candidate | Bill Gahres | 1,693 | 1.2 | N/A | |
Libertarian | John J. Conard | 603 | 0.4 | N/A | |
| Independent Non-Political | Donna Serber | 437 | 0.3 | N/A | |
Independent | David Lyon | 291 | 0.2 | N/A | |
| Jeffersonian | Albert Shaia | 238 | 0.2 | N/A | |
| Service To Mankind | Arthur John Ahrens, Jr. | 188 | 0.1 | N/A | |
| Total votes | 140,515 | 100.0 | |||
| Party | Candidate | Votes | % | |
|---|---|---|---|---|
Democratic | John Paul Doyle | 35,319 | 25.8 | |
Democratic | Daniel F. Newman | 34,381 | 25.1 | |
Republican | Joseph E. Buckelew | 33,097 | 24.2 | |
Republican | Franklin H. Berry, Jr. | 32,579 | 23.8 | |
American | John L. Deckert | 758 | 0.6 | |
Independent | Patrick R. McKee | 590 | 0.4 | |
| Total votes | 136,724 | 100.0 | ||
Election results, 1965–1973
Senate
| Party | Candidate | Votes | % | |
|---|---|---|---|---|
Republican | Nelson F. Stamler | 99,327 | 27.4 | |
Democratic | Mildred Barry Hughes | 92,102 | 25.4 | |
Republican | Peter J. McDonough | 90,261 | 24.9 | |
Democratic | William P. Hourihan | 81,226 | 22.4 | |
| Total votes | 362,916 | 100.0 | ||
| Party | Candidate | Votes | % | |
|---|---|---|---|---|
Republican | Nicholas S. LaCorte | 89,036 | 20.0 | |
Republican | Frank X. McDermott | 88,378 | 19.8 | |
Republican | Matthew J. Rinaldo | 86,656 | 19.4 | |
Democratic | Mildred Barry Hughes | 65,999 | 14.8 | |
Democratic | Lester Weiner | 54,364 | 12.2 | |
Democratic | James J. Kinneally, Sr. | 52,347 | 11.7 | |
| No Unnecessary Taxes | Alexander G. Wrigley | 5,508 | 1.2 | |
| Union Conservative | Kenneth Allardice | 3,854 | 0.9 | |
| Total votes | 446,142 | 100.0 | ||
| Party | Candidate | Votes | % | |
|---|---|---|---|---|
Democratic | Jerry F. English | 73,314 | 50.8 | |
Republican | Van Dyke J. Pollitt | 64,798 | 44.9 | |
| Independent Coalition | Elmer L. Sullivan | 6,305 | 4.4 | |
| Total votes | 144,417 | 100.0 | ||
| Party | Candidate | Votes | % | |
|---|---|---|---|---|
Republican | Matthew J. Rinaldo | 93,608 | 20.6 | |
Republican | Francis X. McDermott | 77,536 | 17.1 | |
Republican | Jerome M. Epstein | 68,531 | 15.09 | |
Democratic | Carmine J. Liotta | 68,131 | 15.00 | |
Democratic | Christopher Dietz | 64,487 | 14.2 | |
Democratic | John T. Connor, Jr. | 63,884 | 14.1 | |
| Independent Coalition | Elmer L. Sullivan | 6,451 | 1.4 | |
| Independent Coalition | Arnold Gold | 6,047 | 1.3 | |
| Independent Coalition | Richard Avant | 5,406 | 1.2 | |
| Total votes | 454,081 | 100.0 | ||
| Party | Candidate | Votes | % | |
|---|---|---|---|---|
Democratic | William J. McCloud | 86,071 | 58.7 | |
Republican | Elizabeth L. Cox | 60,679 | 41.3 | |
| Total votes | 146,750 | 100.0 | ||
Assembly
District 9A
| Party | Candidate | Votes | % | |
|---|---|---|---|---|
Democratic | Joseph J. Higgins | 24,191 | 28.9 | |
Democratic | Henry F. Gavan | 22,306 | 26.6 | |
Republican | Jacqueline Paterson | 17,926 | 21.4 | |
Republican | Valentino D. Imbriaco | 16,979 | 20.3 | |
| Union Conservative | Elizabeth Anne Dering | 1,178 | 1.4 | |
| Union Conservative | Jerome M. Acquisto, Jr. | 1,120 | 1.3 | |
| Total votes | 83,700 | 100.0 | ||
| Party | Candidate | Votes | % | |
|---|---|---|---|---|
Democratic | Joseph J. Higgins | 31,654 | 31.1 | |
Democratic | Henry F. Gavan | 31,004 | 30.4 | |
Republican | Joseph P. Locascio | 20,327 | 19.9 | |
Republican | Alan Coen | 17,291 | 17.0 | |
| National Conservative | William J. O’Grady | 866 | 0.8 | |
| National Conservative | James J. Molloy | 771 | 0.8 | |
| Total votes | 101,913 | 100.0 | ||
| Party | Candidate | Votes | % | |
|---|---|---|---|---|
Democratic | Joseph J. Higgins | 23,497 | 28.4 | |
Democratic | Alexander J. Menza | 22,457 | 27.2 | |
Republican | Leonard Genova | 17,177 | 20.8 | |
Republican | Thomas T. Buckley | 15,019 | 18.2 | |
| Independent Coalition | Wilbert Blackshear | 1,909 | 2.3 | |
| Independent Coalition | Richard Mathisen | 1,783 | 2.2 | |
| No New Taxes | Philip R. Nicolaus | 753 | 0.9 | |
| Total votes | 82,595 | 100.0 | ||
District 9B
| Party | Candidate | Votes | % | |
|---|---|---|---|---|
Republican | Herbert J. Heilmann | 31,542 | 29.6 | |
Republican | Herbert H. Kiehn | 31,490 | 29.5 | |
Democratic | Albert S. Parsonnet | 21,410 | 20.1 | |
Democratic | Herbert Blaustein | 20,618 | 19.3 | |
| Union Conservative | Alexander E. Maleski | 1,605 | 1.5 | |
| Total votes | 106,665 | 100.0 | ||
| Party | Candidate | Votes | % | |
|---|---|---|---|---|
Republican | Herbert J. Heilmann | 40,376 | 29.9 | |
Republican | Hugo M. Pfaltz, Jr. | 40,093 | 29.7 | |
Democratic | Michael J. Mehr | 27,106 | 20.1 | |
Democratic | Peter G. Humanik | 26,636 | 19.7 | |
| National Conservative | Forster G. Ruhl | 918 | 0.7 | |
| Total votes | 135,129 | 100.0 | ||
| Party | Candidate | Votes | % | |
|---|---|---|---|---|
Republican | Elizabeth L. Cox | 33,825 | 59.1 | |
Democratic | Harry W. Foskey | 20,712 | 36.2 | |
| Independent Coalition | David K. McGuire | 2,649 | 4.6 | |
| Total votes | 57,186 | 100.0 | ||
| Party | Candidate | Votes | % | |
|---|---|---|---|---|
Republican | C. Louis Bassano | 28,419 | 25.0 | |
Republican | Herbert H. Kiehn | 28,115 | 24.8 | |
Democratic | Henry F. Gavan | 25,847 | 22.8 | |
Democratic | Donald Lan | 25,798 | 22.7 | |
| Independent Coalition | David K. McGuire | 3,191 | 2.8 | |
| Independent Coalition | Melvin Charles | 2,089 | 1.8 | |
| Total votes | 113,459 | 100.0 | ||
District 9C
| Party | Candidate | Votes | % | |
|---|---|---|---|---|
Republican | Peter J. McDonough | 39,390 | 38.5 | |
Republican | Hugo M. Pfaltz | 36,738 | 35.9 | |
Democratic | George Perselay | 13,750 | 13.4 | |
Democratic | Joseph A. Gannon | 12,411 | 12.1 | |
| Total votes | 102,289 | 100.0 | ||
| Party | Candidate | Votes | % | |
|---|---|---|---|---|
Republican | Peter J. McDonough | 36,116 | 30.2 | |
Republican | Herbert H. Kiehn | 34,165 | 28.6 | |
Democratic | Thomas H. Hannen | 24,684 | 20.6 | |
Democratic | John F. Allaire, Jr. | 24,647 | 20.6 | |
| Total votes | 119,612 | 100.0 | ||
| Party | Candidate | Votes | % | |
|---|---|---|---|---|
Republican | Peter J. McDonough | 32,463 | 33.9 | |
Republican | Arthur A. Manner | 28,913 | 30.2 | |
Democratic | Eugene Campbell | 17,559 | 18.3 | |
Democratic | A. Charles Walano | 16,893 | 17.6 | |
| Total votes | 95,828 | 100.0 | ||
District 9 At-large
| Party | Candidate | Votes | % | |
|---|---|---|---|---|
Republican | Charles J. Irwin | 84,750 | 58.3 | |
Democratic | Everett C. Lattimore | 57,427 | 39.5 | |
| No Unnecessary Taxes | Eugene Daddio | 3,188 | 2.2 | |
| Total votes | 145,365 | 100.0 | ||
| Party | Candidate | Votes | % | |
|---|---|---|---|---|
Republican | Charles J. Irwin | 88,195 | 49.7 | |
Democratic | John T. Connor, Jr. | 87,061 | 49.0 | |
| National Conservative | Harold J. Kauffmann | 2,311 | 1.3 | |
| Total votes | 177,567 | 100.0 | ||
References
^ Districts by Number, New Jersey Legislature. Accessed January 29, 2014.
^ DP-1: Profile of General Population and Housing Characteristics: 2010 from the 2010 Demographic Profile Data for the General Assembly District 9 (2010), New Jersey, United States Census Bureau. Accessed January 29, 2014.
^ Statewide Voter Registration Summary, New Jersey Department of State, November 30, 2017. Accessed December 28, 2017.
^ Legislative Roster 2018-2019 Session, New Jersey Legislature. Accessed January 10, 2018.
^ District 9 Legislators, New Jersey Legislature. Accessed January 10, 2018.
^ ab "Results of the General Election Held on November 2, 1965" (PDF). Secretary of State of New Jersey. Retrieved July 11, 2015..mw-parser-output cite.citation{font-style:inherit}.mw-parser-output q{quotes:"""""""'""'"}.mw-parser-output code.cs1-code{color:inherit;background:inherit;border:inherit;padding:inherit}.mw-parser-output .cs1-lock-free a{background:url("//upload.wikimedia.org/wikipedia/commons/thumb/6/65/Lock-green.svg/9px-Lock-green.svg.png")no-repeat;background-position:right .1em center}.mw-parser-output .cs1-lock-limited a,.mw-parser-output .cs1-lock-registration a{background:url("//upload.wikimedia.org/wikipedia/commons/thumb/d/d6/Lock-gray-alt-2.svg/9px-Lock-gray-alt-2.svg.png")no-repeat;background-position:right .1em center}.mw-parser-output .cs1-lock-subscription a{background:url("//upload.wikimedia.org/wikipedia/commons/thumb/a/aa/Lock-red-alt-2.svg/9px-Lock-red-alt-2.svg.png")no-repeat;background-position:right .1em center}.mw-parser-output .cs1-subscription,.mw-parser-output .cs1-registration{color:#555}.mw-parser-output .cs1-subscription span,.mw-parser-output .cs1-registration span{border-bottom:1px dotted;cursor:help}.mw-parser-output .cs1-hidden-error{display:none;font-size:100%}.mw-parser-output .cs1-visible-error{font-size:100%}.mw-parser-output .cs1-subscription,.mw-parser-output .cs1-registration,.mw-parser-output .cs1-format{font-size:95%}.mw-parser-output .cs1-kern-left,.mw-parser-output .cs1-kern-wl-left{padding-left:0.2em}.mw-parser-output .cs1-kern-right,.mw-parser-output .cs1-kern-wl-right{padding-right:0.2em}
^ abcdefg "Results of the General Election Held on November 7, 1967" (PDF). Secretary of State of New Jersey. Retrieved July 11, 2015.
^ abc Manual of the Legislature of New Jersey - Two Hundred and Eleventh Legislature (First Session) (PDF). Skinder-Strauss Associates. 2004. Retrieved July 11, 2015.
^ abcdefgh "Results of the General Election Held on November 2, 1971" (PDF). Secretary of State of New Jersey. Retrieved July 11, 2015.
^ New Jersey Apportionment Commission (July 20, 1967). "New Jersey Senate and Assembly Districts" (PDF). Retrieved July 11, 2015.
^ State of New Jersey (1971). "New Jersey Senate and Assembly Districts 1972–1973" (PDF). Retrieved July 11, 2015.
^ abcde "Results of the General Election Held on November 4, 1969" (PDF). Secretary of State of New Jersey. Retrieved July 11, 2015.
^ "New Jersey Legislative Districts 1974–" (PDF). New Jersey Legislative Services Agency. 1973. Retrieved July 11, 2015.
^ "New Jersey Legislative Districts" (PDF). 1981. Retrieved July 11, 2015.
^ "1991 Legislative Districts" (PDF). 1991. Archived from the original (PDF) on March 4, 2016. Retrieved July 11, 2015.
^ "2001 Legislative Districts" (PDF). 2001. Archived from the original (PDF) on August 11, 2011. Retrieved July 11, 2015.
^ Levine, Bruce (August 28, 1985). "Spurned GOP lawmaker now on Democratic ticket". Asbury Park Press. Retrieved September 2, 2017.
^ "Official List, Candidates for State Senate For GENERAL ELECTION 11/07/2017 Election" (PDF). Secretary of State of New Jersey. November 29, 2017. Retrieved December 28, 2017.
^ "Official List, Candidates for State Senate for GENERAL ELECTION 11/05/2013 Election" (PDF). Secretary of State of New Jersey. Retrieved December 21, 2015.
^ "Official List, Candidate Returns for State Senate for November 2011 General Election" (PDF). Secretary of State of New Jersey. Retrieved December 21, 2015.
^ "Official List, Candidate Returns for State Senate for November 2007 General Election" (PDF). Secretary of State of New Jersey. Retrieved December 21, 2015.
^ "Official List, Candidate Returns for State Senate for November 2003 General Election" (PDF). Secretary of State of New Jersey. Retrieved December 21, 2015.
^ "Official List, Candidate Returns for State Senate for November 2001 General Election" (PDF). Secretary of State of New Jersey. Retrieved December 21, 2015.
^ "Official Results, General Election Returns for the Office of State Senate for Election Held November 4, 1997" (PDF). Secretary of State of New Jersey. Retrieved December 21, 2015.
^ "THE 1997 ELECTIONS: RESULTS; The Races for New Jersey Senate". The New York Times. Retrieved May 6, 2016.
^ ab "Official List, General Election Returns for the Office of Senate and Assembly for Election Held November 2, 1993" (PDF). Secretary of State of New Jersey. Retrieved December 21, 2015.
^ ab "Official Results, General Election, November 5, 1991" (PDF). Secretary of State of New Jersey. Retrieved December 21, 2015.
^ ab "Candidates for the Offices of State Senate and General Assembly" (PDF). Secretary of State of New Jersey. Retrieved December 21, 2015.
^ ab "Candidates for the Offices of State Senate and General Assembly" (PDF). Secretary of State of New Jersey. Retrieved December 21, 2015.
^ ab "Candidates for the Offices of State Senate and General Assembly" (PDF). Secretary of State of New Jersey. Retrieved December 21, 2015.
^ ab "Results of the General Election Held November 8, 1977" (PDF). Secretary of State of New Jersey. Retrieved December 21, 2015.
^ abc "Results of the General Election Held November 6, 1973" (PDF). Secretary of State of New Jersey. Retrieved December 21, 2015.
^ "Official List, Candidates for General Assembly For GENERAL ELECTION 11/07/2017 Election" (PDF). Secretary of State of New Jersey. November 29, 2017. Retrieved December 28, 2017.
^ "Official List, Candidates for General Assembly for GENERAL ELECTION 11/03/2015 Election" (PDF). Secretary of State of New Jersey. Retrieved December 21, 2015.
^ "Official List, Candidates for General Assembly for GENERAL ELECTION 11/05/2013 Election" (PDF). Secretary of State of New Jersey. Retrieved December 21, 2015.
^ "Official List, Candidate Returns for General Assembly for November 2011 General Election" (PDF). Secretary of State of New Jersey. Retrieved December 21, 2015.
^ "Official List, Candidate Returns for General Assembly for November 2009 General Election" (PDF). Secretary of State of New Jersey. Retrieved December 21, 2015.
^ "Official List, Candidate Returns for General Assembly for November 2007 General Election" (PDF). Secretary of State of New Jersey. Retrieved December 21, 2015.
^ "Official List, Candidate Returns for General Assembly for November 2005 General Election" (PDF). Secretary of State of New Jersey. Retrieved December 21, 2015.
^ "Official List, Candidate Returns for General Assembly 12-02-2003 for November 2003 General Election" (PDF). Secretary of State of New Jersey. Retrieved December 21, 2015.
^ "Official List, Candidate Returns for General Assembly for November 2001 General Election" (PDF). Secretary of State of New Jersey. Retrieved December 21, 2015.
^ "Official List, Candidate Returns for General Assembly 01-11-2010 for November 1999 General Election" (PDF). Secretary of State of New Jersey. Retrieved December 21, 2015.
^ "Official Results, General Election Returns for the Office of State Assembly for Election Held November 4, 1997" (PDF). Secretary of State of New Jersey. Retrieved December 21, 2015.
^ "THE 1997 ELECTIONS: RESULTS; The Races for the New Jersey Assebly". The New York Times. Retrieved May 6, 2016.
^ "Official List, General Election Results for the Office of General Assembly for Election Held November 7, 1995" (PDF). Secretary of State of New Jersey. Retrieved December 21, 2015.
^ "NJ General Assembly 09". Our Campaigns. Retrieved September 2, 2017.
^ "Candidates for the Office of General Assembly" (PDF). Secretary of State of New Jersey. Retrieved December 21, 2015.
^ "Candidates for the Office of General Assembly" (PDF). Secretary of State of New Jersey. Retrieved December 21, 2015.
^ "Results of the General Election Held on November 6, 1979" (PDF). Secretary of State of New Jersey. Retrieved December 21, 2015.
^ "Results of the General Election Held November 4, 1975" (PDF). Secretary of State of New Jersey. Retrieved December 21, 2015.


